디자인킷 · 그래프
워터폴(증감 누적)
D-그래프-워터폴
언제 쓰는가
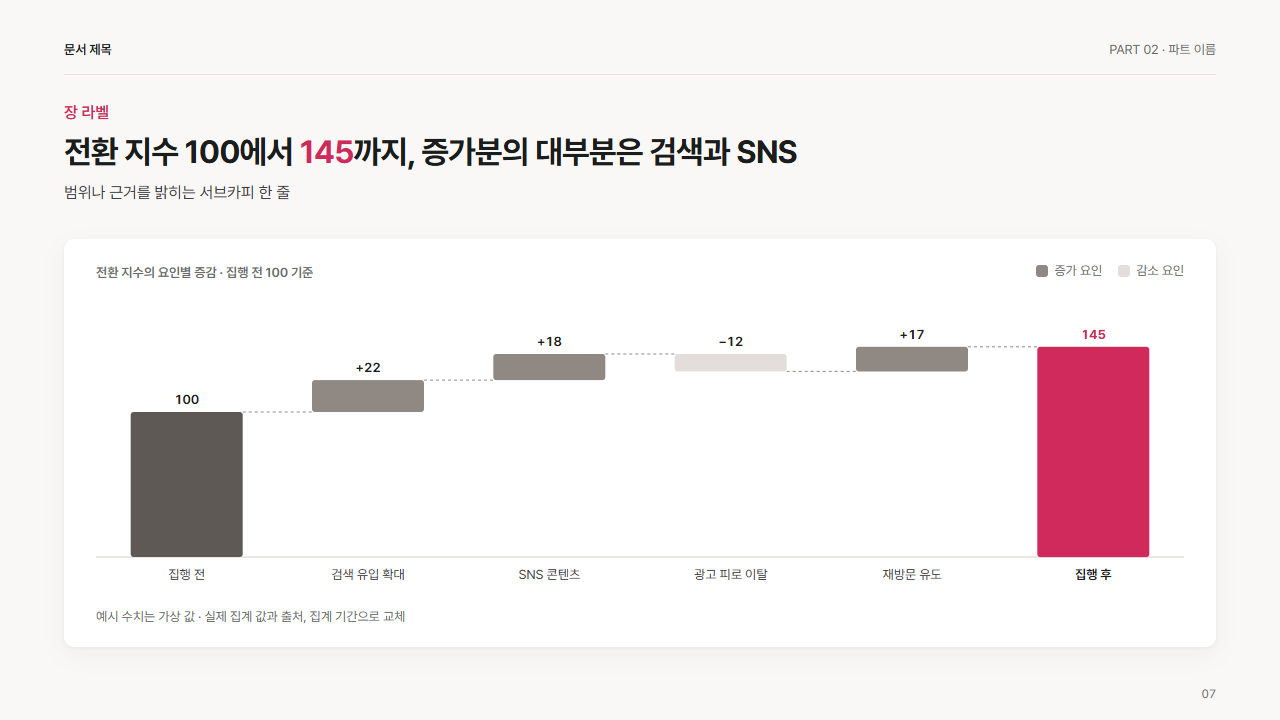
시작 값이 어떤 요인들로 늘고 줄어 최종 값이 되었는지 분해. 성과 요인 분석, 목표까지의 기여 계획. 가운데 요인 3~6개(전체 막대 5~8개). 증가는 진회색, 감소는 옅은 회색, 최종 값만 강조색. 값 바꾸는 법: 1 지수 = 1.5px(축 최댓값 160 = 232px, 값이 커지면 232 ÷ 축 최댓값으로 다시 계산). 시작·최종 막대: height = 값 × 1.5, y = 262 − height. 증감 막대: height = |증감| × 1.5, y = 262 − max(직전 누계, 새 누계) × 1.5. 연결 점선 y = 262 − 새 누계 × 1.5. 칸 폭 = 1088 ÷ 막대 수, 막대 x = 칸 × 순번 + (칸 폭 − 112) ÷ 2. 감소 값 라벨은 "−12" 처럼 빼기 기호로 표기.
참고
컨설팅 장표 차트 관행 정리(https://deckary.com/blog/present-data-effectively-powerpoint)의 waterfall(bridge) 관행: 기준 막대, 증가와 감소의 구분, 최종 합계. Financial Times Visual Vocabulary(https://github.com/Financial-Times/chart-doctor/tree/main/visual-vocabulary) Deviation·Flow 분류 참고. 직접 제작.
조각
<div class="dk dk-wfall">
<div class="dk-card">
<p class="ttl"><span>전환 지수의 요인별 증감 · 집행 전 100 기준</span><span class="lg"><span><i class="c-g3"></i>증가 요인</span><span><i class="c-g1"></i>감소 요인</span></span></p>
<svg width="1088" height="300" viewBox="0 0 1088 300" role="img">
<line x1="0" y1="262" x2="1088" y2="262" class="ax"/>
<rect x="34.7" y="117" width="112" height="145" rx="3" class="g4"/><text x="90.7" y="109" text-anchor="middle" class="v">100</text><text x="90.7" y="284" text-anchor="middle" class="k">집행 전</text><line x1="146.7" y1="117" x2="216" y2="117" class="cn"/>
<rect x="216" y="85.1" width="112" height="31.9" rx="3" class="g3"/><text x="272" y="77.1" text-anchor="middle" class="v">+22</text><text x="272" y="284" text-anchor="middle" class="k">검색 유입 확대</text><line x1="328" y1="85.1" x2="397.3" y2="85.1" class="cn"/>
<rect x="397.3" y="59" width="112" height="26.1" rx="3" class="g3"/><text x="453.3" y="51" text-anchor="middle" class="v">+18</text><text x="453.3" y="284" text-anchor="middle" class="k">SNS 콘텐츠</text><line x1="509.3" y1="59" x2="578.6" y2="59" class="cn"/>
<rect x="578.7" y="59" width="112" height="17.4" rx="3" class="g1"/><text x="634.7" y="51" text-anchor="middle" class="v">−12</text><text x="634.7" y="284" text-anchor="middle" class="k">광고 피로 이탈</text><line x1="690.7" y1="76.4" x2="760" y2="76.4" class="cn"/>
<rect x="760" y="51.8" width="112" height="24.7" rx="3" class="g3"/><text x="816" y="43.8" text-anchor="middle" class="v">+17</text><text x="816" y="284" text-anchor="middle" class="k">재방문 유도</text><line x1="872" y1="51.8" x2="941.3" y2="51.8" class="cn"/>
<rect x="941.3" y="51.8" width="112" height="210.3" rx="3" class="a"/><text x="997.3" y="43.8" text-anchor="middle" class="va">145</text><text x="997.3" y="284" text-anchor="middle" class="v">집행 후</text>
</svg>
<p class="note">예시 수치는 가상 값 · 실제 집계 값과 출처, 집계 기간으로 교체</p>
</div>
</div>
스타일
.dk-wfall .dk-card{padding:22px 32px 20px}
.dk-wfall .ttl{display:flex;justify-content:space-between;align-items:baseline;font-size:var(--f-cap);font-weight:600;color:var(--mu);margin:0 0 var(--s3)}
.dk-wfall .lg{display:flex;gap:var(--s4);font-weight:400}
.dk-wfall .lg span{display:flex;align-items:center;gap:6px}
.dk-wfall .lg i{display:block;width:12px;height:12px;border-radius:3px}
.dk-wfall .lg i.c-a{background:var(--ac)}
.dk-wfall .lg i.c-s{background:var(--soft)}
.dk-wfall .lg i.c-g1{background:var(--g1)}
.dk-wfall .lg i.c-g2{background:var(--g2)}
.dk-wfall .lg i.c-g3{background:var(--g3)}
.dk-wfall .lg i.c-g4{background:var(--g4)}
.dk-wfall .note{font-size:var(--f-cap);color:var(--mu);margin:var(--s3) 0 0}
.dk-wfall svg{display:block}
.dk-wfall svg text{font-family:inherit;font-size:13px;fill:var(--mu);font-variant-numeric:tabular-nums}
.dk-wfall svg .a{fill:var(--ac)}
.dk-wfall svg .sf{fill:var(--soft)}
.dk-wfall svg .g1{fill:var(--g1)}
.dk-wfall svg .g2{fill:var(--g2)}
.dk-wfall svg .g3{fill:var(--g3)}
.dk-wfall svg .g4{fill:var(--g4)}
.dk-wfall svg .ax{stroke:var(--line2);stroke-width:1;fill:none}
.dk-wfall svg .gr{stroke:var(--line);stroke-width:1;fill:none}
.dk-wfall svg text.k{fill:var(--ink2)}
.dk-wfall svg text.v{fill:var(--ink);font-weight:600}
.dk-wfall svg text.va{fill:var(--ac);font-weight:700}
.dk-wfall svg text.on{fill:var(--card);font-weight:600}
.dk-wfall svg .cn{stroke:var(--g3);stroke-width:1;stroke-dasharray:3 3}