디자인킷 · 그래프
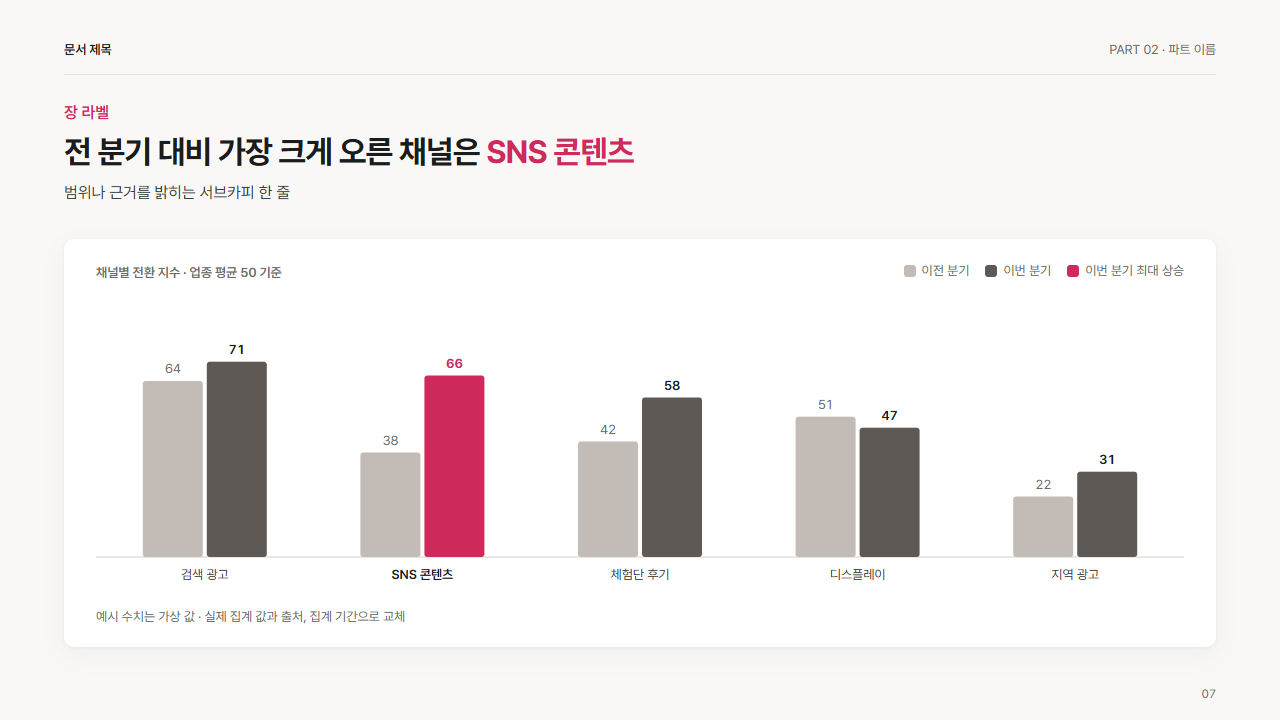
묶음 막대 2계열 비교
D-그래프-묶음막대-2계열
언제 쓰는가
같은 항목을 두 시점 또는 두 대상(이전·이번, 우리·경쟁)으로 나란히 비교. 항목 3~6개, 계열은 2개까지. 계열이 3개 이상이면 표나 작은 그래프 여러 개로 분리. 값 바꾸는 법: 막대 height = 값 ÷ 80(축 최댓값) × 220, y = 262 − height. 묶음 가운데 cx = 칸 폭 × 순번 + 칸 폭 ÷ 2(칸 폭 = 1088 ÷ 항목 수). 왼쪽 막대 x = cx − 62, 오른쪽 막대 x = cx + 2. 강조는 한 묶음의 오른쪽 막대만 class="a". 범례 문구는 .lg 안에서 교체.
참고
Datawrapper Academy(https://www.datawrapper.de/academy/customizing-your-bar-chart)의 grouped bars(https://www.datawrapper.de/charts/grouped-bars) 구성, 컨설팅 장표 차트 관행 정리(https://deckary.com/blog/present-data-effectively-powerpoint)의 "증명하는 값 하나만 색" 원칙 참고. 직접 제작.
조각
<div class="dk dk-gbar">
<div class="dk-card">
<p class="ttl"><span>채널별 전환 지수 · 업종 평균 50 기준</span><span class="lg"><span><i class="c-g2"></i>이전 분기</span><span><i class="c-g4"></i>이번 분기</span><span><i class="c-a"></i>이번 분기 최대 상승</span></span></p>
<svg width="1088" height="300" viewBox="0 0 1088 300" role="img">
<line x1="0" y1="262" x2="1088" y2="262" class="ax"/>
<rect x="46.8" y="86" width="60" height="176" rx="3" class="g2"/><text x="76.8" y="78" text-anchor="middle">64</text><rect x="110.8" y="66.7" width="60" height="195.3" rx="3" class="g4"/><text x="140.8" y="58.7" text-anchor="middle" class="v">71</text><text x="108.8" y="284" text-anchor="middle" class="k">검색 광고</text>
<rect x="264.4" y="157.5" width="60" height="104.5" rx="3" class="g2"/><text x="294.4" y="149.5" text-anchor="middle">38</text><rect x="328.4" y="80.5" width="60" height="181.5" rx="3" class="a"/><text x="358.4" y="72.5" text-anchor="middle" class="va">66</text><text x="326.4" y="284" text-anchor="middle" class="v">SNS 콘텐츠</text>
<rect x="482" y="146.5" width="60" height="115.5" rx="3" class="g2"/><text x="512" y="138.5" text-anchor="middle">42</text><rect x="546" y="102.5" width="60" height="159.5" rx="3" class="g4"/><text x="576" y="94.5" text-anchor="middle" class="v">58</text><text x="544" y="284" text-anchor="middle" class="k">체험단 후기</text>
<rect x="699.6" y="121.7" width="60" height="140.3" rx="3" class="g2"/><text x="729.6" y="113.7" text-anchor="middle">51</text><rect x="763.6" y="132.7" width="60" height="129.3" rx="3" class="g4"/><text x="793.6" y="124.7" text-anchor="middle" class="v">47</text><text x="761.6" y="284" text-anchor="middle" class="k">디스플레이</text>
<rect x="917.2" y="201.5" width="60" height="60.5" rx="3" class="g2"/><text x="947.2" y="193.5" text-anchor="middle">22</text><rect x="981.2" y="176.7" width="60" height="85.3" rx="3" class="g4"/><text x="1011.2" y="168.7" text-anchor="middle" class="v">31</text><text x="979.2" y="284" text-anchor="middle" class="k">지역 광고</text>
</svg>
<p class="note">예시 수치는 가상 값 · 실제 집계 값과 출처, 집계 기간으로 교체</p>
</div>
</div>
스타일
.dk-gbar .dk-card{padding:22px 32px 20px}
.dk-gbar .ttl{display:flex;justify-content:space-between;align-items:baseline;font-size:var(--f-cap);font-weight:600;color:var(--mu);margin:0 0 var(--s3)}
.dk-gbar .lg{display:flex;gap:var(--s4);font-weight:400}
.dk-gbar .lg span{display:flex;align-items:center;gap:6px}
.dk-gbar .lg i{display:block;width:12px;height:12px;border-radius:3px}
.dk-gbar .lg i.c-a{background:var(--ac)}
.dk-gbar .lg i.c-s{background:var(--soft)}
.dk-gbar .lg i.c-g1{background:var(--g1)}
.dk-gbar .lg i.c-g2{background:var(--g2)}
.dk-gbar .lg i.c-g3{background:var(--g3)}
.dk-gbar .lg i.c-g4{background:var(--g4)}
.dk-gbar .note{font-size:var(--f-cap);color:var(--mu);margin:var(--s3) 0 0}
.dk-gbar svg{display:block}
.dk-gbar svg text{font-family:inherit;font-size:13px;fill:var(--mu);font-variant-numeric:tabular-nums}
.dk-gbar svg .a{fill:var(--ac)}
.dk-gbar svg .sf{fill:var(--soft)}
.dk-gbar svg .g1{fill:var(--g1)}
.dk-gbar svg .g2{fill:var(--g2)}
.dk-gbar svg .g3{fill:var(--g3)}
.dk-gbar svg .g4{fill:var(--g4)}
.dk-gbar svg .ax{stroke:var(--line2);stroke-width:1;fill:none}
.dk-gbar svg .gr{stroke:var(--line);stroke-width:1;fill:none}
.dk-gbar svg text.k{fill:var(--ink2)}
.dk-gbar svg text.v{fill:var(--ink);font-weight:600}
.dk-gbar svg text.va{fill:var(--ac);font-weight:700}
.dk-gbar svg text.on{fill:var(--card);font-weight:600}